From Grids to Growth: Why Spreadsheets Will Never Be a True CRM
August 1, 2025
•
By
Eve
•
X
min read
The cosy comfort of spreadsheets
Spreadsheets are the office equivalent of a well‑worn cardigan, reliable, familiar and almost impossible to throw away. More than one billion people open Excel or Google Sheets each month according to Microsoft, and 54 percent of small‑business owners still use them to track customers, quotes or inventory. In the very earliest phase of a venture, a single worksheet can indeed feel adequate. Columns labelled Name, Email, Status and Next step look deceptively like a miniature sales pipeline.
At Yopla we greet this DIY spirit with genuine respect. We started exactly the same way, capturing early enquiries in a colour‑coded sheet, adding comments in hidden columns and emailing each other attachment updates. It worked, until it did not. As activity grew past a few dozen deals, the brittle nature of the file became painfully obvious.
See our primer on digital transformation strategy for guidance on recognising other tools that quietly outgrow their usefulness.
The spreadsheet temptation checklist
Appeal
Reality check
Zero licence fee. Excel is part of Office 365, Google Sheets is free.
Free tools are rarely free when labour is counted. Data entry, error fixing and version policing consume real salaries.
Total flexibility. Add any column, format or colour on a whim.
Undisciplined schema changes lead to incoherent data, broken formulas and lost historical trend lines.
No approval cycles. IT governance seldom blocks a new tab in an existing file.
Lack of oversight increases security exposure, especially when customer data travels by email attachment.
Low learning curve. Everyone claims to “know Excel”.
Competence varies wildly, and tribal macros quickly become single points of failure.
Even this table hints at why convenience can morph into chaos. Those costs remain hidden while the dataset is tiny, then compound aggressively.
Spreadsheet mayhem in full colour
If you recognise any of the following scenes, your organisation has probably outgrown the grid.
The version‑control hydra
The folder contains Clients Q4 FINAL.xlsx, Clients Q4 FINAL v2.xlsx and, infamously, Clients Q4 FINAL v2 REAL FINAL.xlsx. Nobody is sure which document drives Monday’s forecast meeting. Two colleagues edit different files over the weekend, reconciling them on Monday burns an hour and several brain cells.
A 2024 Harvard Business Review survey found that sales teams lose 12 percent of weekly selling time to manual data reconciliation. That is one working day every fortnight spent wrangling spreadsheets rather than winning revenue.
Collaborative carnage
Google Sheets allows concurrent editing, but throw five eager representatives into the same workbook and carnage ensues. Someone sorts a single column, misaligning rows. Another applies a global filter, hiding half the pipeline. Audit trails exist, yet untangling the mess is slower than dealing with the client who just called twice.
Human error roulette
Consultancy PwC estimates that 90 percent of spreadsheets contain non‑trivial errors. JPMorgan’s infamous London Whale trading scandal, which racked up a USD 6 billion loss, partly stemmed from faulty copy‑pasted formulas. Your firm may never flirt with that scale of catastrophe, but one misplaced decimal in a quote can still scupper a deal and tarnish credibility.
The reporting black hole
Management requests “conversion rate by channel for the last three quarters”. The answer involves exporting CSVs, building pivot tables and manually stitching graphs. By the time the slide deck is ready, numbers are already stale. Data‑driven decision‑making becomes wishful thinking.
Zero automation, zero reminders
Spreadsheets do not nudge reps that a follow‑up email is due, cannot trigger a task when a proposal goes unanswered for seven days, and do not consolidate activities across multiple communication channels. Reliance on personal calendars invites inconsistency.
Fragility and security gaps
One corrupted file, synchronisation glitch or unexpected ransomware incident and the entire “CRM” disappears. Backups help, but multiplying unsecured copies multiplies risk. Data protection regulators have grown less forgiving about casual handling of personally identifiable information.
For more on mitigating operational risk, explore our article on sustainable AI which covers governance principles equally relevant to data tooling.
The economics of stagnation
Hidden spreadsheet costs manifest in three broad buckets:
Labour drag: Manual updates, duplicate entry and error correction steal time from quota‑carrying activities. A Yopla benchmarking exercise across twelve B2B clients showed reps shackled to Excel spent 22 percent less time in live customer conversations compared with peers on modern CRMs.
Missed revenue: Delayed follow‑ups and opaque pipeline health translate into lost deals. Even a five‑percent slip in win rate can dwarf the licence fee of any commercial platform.
Poor intelligence: Decisions rely on anecdote rather than analytics. Forecasts become sandcastles, impressive at first glance yet easily washed away.
Gartner quantifies the opportunity cost succinctly in its 2025 Sales Technology Guide, noting that organisations deploying mature CRM workflows capture up to twenty per cent higher customer lifetime value versus spreadsheet stalwarts. Access the full report here.
What a modern CRM delivers
A Customer Relationship Management platform is purpose built to replace chaos with coherence. Feature sets vary, however the following pillars are now table stakes.
Unified contact timeline
Every call, email, note, proposal and support ticket attaches to a single contact record. History never hides in Bob’s inbox or Jane’s sticky note. Privacy controls ensure the right people see the right data. Contrast this with spreadsheets, where context fragments across channels faster than you can say VLOOKUP.
Automated data capture and enrichment
Integrations with email, telephony and web forms mean interactions log themselves. Third‑party enrichment services append firmographic details such as industry, revenue band and LinkedIn profile, saving research time. No rep needs to copy and paste job titles at midnight.
Visual deal pipelines
Kanban‑style boards provide at‑a‑glance status. Drag a card from Demo booked to Negotiation and probability‑weighted forecasts update instantly. Managers gain early warning of stalls, enabling coaching rather than post‑mortems.
Nurture automation and alerts
Sequenced emails, SMS reminders and task triggers keep prospects warm without manual intervention. If a hot lead fails to reply within two days, the system nudges the account owner. Some platforms even suggest optimal send times based on engagement history.
Reporting that inspires action
Dashboards refresh in real time, comparing pipeline velocity, win ratios and average deal value across segments. Trend lines help correlate marketing campaigns with revenue. Finance departments love the cleaner accrual forecasting.
Ecosystem integrations
CRMs rarely act alone. They sync with e‑commerce engines, customer‑support desks, accountancy packages and marketing‑automation suites. Data flows seamlessly, eradicating re‑keying chores. Zapier lists over 5,000 pre‑built connectors.
Mobile productivity
Native apps let reps log notes straight after meetings, capture business‑card scans and access playbooks on the train. Offline caching protects productivity when signal drops.
Security and compliance
Role‑based access, audit logs, encryption at rest and in transit, multi‑factor authentication and data residency options satisfy even risk‑averse sectors. Leading vendors pursue ISO 27001, SOC 2 and GDPR‑ready processes as standard.
For a broader look at responsible technology adoption, see Yopla’s upcoming white paper on Trusted Tech in Financial Services releasing next quarter.
Signals you are ready to graduate
Symptom
What it means
Five or more salespeople touch the same data daily.
Coordination overhead now outstrips spreadsheet convenience.
Forecast accuracy swings beyond ±15 percent each quarter.
Morale and productivity fall, attrition risk rises.
Customers slip through cracks because someone “forgot to update the sheet”.
Opportunity cost mounts, brand trust suffers.
If three or more boxes apply, you are already paying the price of not switching.
Building the business case
Executives often hesitate at perceived complexity and cost. Address those anxieties with evidence.
Total cost of ownership: Factor licence fees, implementation services and internal time versus current spreadsheet labour and error losses. Case studies show payback within nine months for mid‑market firms.
Revenue uplift: Model a conservative five‑percent win‑rate boost and ten‑percent pipeline velocity gain. Multiply by average deal size for concrete numbers.
Risk reduction: Quantify regulatory fines avoided and customer churn prevented through stronger data hygiene.
Harvard Business Review’s Analytics in Action series offers templates for ROI calculations, available here.
Migration without migraines
Transitioning sounds daunting, yet with structured planning it becomes manageable.
Choose the right platform
Map requirements first. Do you need service tickets, subscription billing or field‑service modules. Shortlist vendors accordingly. Independent reviews from G2 and Forrester Wave provide unbiased insights.
Clean and enrich data
Use the migration as a spring‑clean. De‑duplicate contacts, validate emails with tools like NeverBounce and enrich firmographics via Clearbit. Garbage in still equals garbage out, even in flashy software.
Phase the rollout
Pilot with a champion team for 30 days, gather feedback, iterate workflows, then expand. Early wins build momentum and dispel scepticism.
Train for adoption
Blend live workshops, bite‑sized video guides and office‑hour clinics. Recognise that change management is cultural as much as technical.
Automate first‑run wins
Configure a simple nurture sequence, dashboard and alert in week one. Visible time savings win hearts quickly.
Yopla’s Agile Tech Playbook outlines a sprint‑based approach particularly suited to CRM projects.
Case vignette: From Excel to exponential insight
A regional professional‑services firm approached Yopla in 2024. Twelve consultants tracked leads in three spreadsheets peppered with colour codes. Forecast accuracy wavered by twenty‑five per cent, and follow‑ups fell through cracks after busy conference seasons.
We implemented a cloud‑based CRM in eight weeks. Automated email capture cut manual entry by forty hours per month, new dashboards surfaced the top three referral channels, enabling marketing to double down where ROI soared. Within two quarters, win rate climbed from thirty‑two to forty per cent, adding nearly GBP 420,000 in annual revenue. License and implementation costs were recouped in six months.
The bigger picture: Customer‑centric culture
Technology is only half the story. A CRM becomes a catalyst for wider cultural change.
Shared language: Definitions of lead, opportunity and customer success move from hazy folklore to clear taxonomy.
Data‑driven coaching: Managers coach from real metrics instead of gut instinct, lifting average performance rather than chasing outliers.
Closed‑loop marketing: Campaigns tie directly to revenue outcomes, ironing out the perennial tension between sales and marketing teams.
Customer lifetime value focus: Support tickets, upsells and renewals live in the same ecosystem, encouraging long‑term relationship building over transactional selling.
Frequently asked questions
Q: Is any spreadsheet ever acceptable once we have a CRM. A: Absolutely, spreadsheets still excel at quick what‑if analyses or ad‑hoc imports. The rule of thumb, if data needs collaborative updates or audit trails, store it in the CRM and export summaries when necessary.
Q: Our processes are unique, will an off‑the‑shelf tool bend to us. A: Most modern platforms support custom objects, fields and automations. Resist over‑customising on day one, adopt native patterns where possible, then iterate.
Q: How do we protect sensitive notes in a shared system. A: Role‑based permissions let you restrict fields or entire records to specific teams. Many vendors also offer field‑level encryption for extra peace of mind.
Q: Can we integrate our home‑grown quoting tool. A: Likely yes. Open REST APIs or middleware such as Zapier or Mulesoft connect bespoke tools with mainstream CRMs. Budget a small development sprint to map data‑flows securely.
Conclusion: set your sights beyond the grid
Spreadsheets are extraordinary number crunchers, yet as a stand‑in for a CRM they turn from comfort blanket to straitjacket. The moment you manage dozens of relationships rather than a handful, the penalty manifests as lost time, diminished insight and avoidable risk.
Graduating to a dedicated platform is less about shiny software and more about giving your team the headroom to excel at what humans do best, building trust, solving problems and closing deals. The tools should orchestrate data quietly in the background, not dictate elaborate workarounds.
If you feel the pain points outlined above, you are not alone. According to Capterra, 91 percent of companies with eleven or more employees already rely on CRM technology. Staying off that train may feel comfortable now, yet comfort rarely fuels growth.
Next steps with Yopla
Yopla has guided start‑ups, charities and multinationals through CRM selection and implementation. We combine vendor‑agnostic advice, data‑governance expertise and change‑management know‑how, bringing clarity where others bring complexity.
If you would like a candid discussion about where your spreadsheet setup creaks and how a CRM could accelerate growth, reach out today. No jargon, no pressure, simply insight you can act on.
Ready for Clarity?
Still thinking about what you just read? That’s usually a sign. So don’t sit on it. Book a quick chat - no pressure.
We’ll help you make sense of the friction, share something genuinely useful, and maybe even turn that spark into real momentum. No jargon. No pitch. Just clarity - and the next right move.
The No-Nonsense Guide to Creating Security, Recovery, and Continuity Plans That Actually Work
Or: How to Keep Your Business Running Even When Everything Goes Sideways
Let's be honest. Most business resilience planning feels like preparing for the zombie apocalypse – lots of drama, complex diagrams, and procedures that nobody will remember when things actually go wrong.
At Yopla, we've taken a different approach. One that's actually useful when your email server decides to take an unscheduled holiday, or when Dave from accounting clicks that "definitely-not-suspicious" link.
Here's how to build security and recovery plans that your team will actually use.
When people talk about digital transformation consulting, it's easy to think it's all about plugging in new technology. That’s not the full story. True transformation is a strategic partnership to modernise your organisation by aligning your people, processes, and technology.
What Are Digital Transformation Consulting Services?
Think of it like renovating a house. You wouldn't just scatter a few smart speakers around and call it modern. You'd rethink the layout, update the plumbing, and rewire the electrics to create a space that genuinely works for the people living there. That’s the real essence of digital transformation consulting services. It’s a methodical way of making your business work better from the inside out.
We’ve learned that real, lasting change starts with understanding your team's day-to-day challenges first. This people-first approach is the only way to cut through the operational fog that holds businesses back. It ensures any new system actually serves your core goals. It’s about building a more open, capable, and operationally sustainable organisation.
It's More Than Just Installing Software
Too often, "transformation" is misunderstood as a simple tech project. A consultant might suggest a new software platform, manage the installation, and then disappear. This rarely sticks because it overlooks the human side of the equation. True transformation consulting looks at the whole picture.
It starts by asking the right questions.
How do your teams really work, and where are the frustrating bottlenecks?.
What manual, repetitive tasks are draining their time and enthusiasm?.
Are your current systems talking to each other, or are they creating digital silos?.
Does your leadership team have the clear, unified data needed for sharp decisions?.
By starting with people and process, we make sure technology becomes an enabler, not just another tool to juggle.
The goal isn't just to install new software. It's to embed a new way of working that frees up your team's time, improves collaboration, and builds lasting capability inside your organisation.
A good consultant breaks down a digital transformation project into clear, manageable components. This helps everyone understand the path from strategy to execution.
Core Components of Digital Transformation Consulting
Service Component
Objective
Typical Activities
Strategy & Roadmap
To define a clear vision and actionable plan.
Workshops, stakeholder interviews, market analysis, business case development.
Process Re-engineering
To identify and eliminate operational inefficiencies.
Workflow mapping, bottleneck analysis, process automation.
Communication planning, training programs, feedback loops.
Data & Analytics
To enable data-driven decision-making.
Data migration, dashboard creation, establishing key metrics.
This structured approach ensures that every aspect of the transformation is aligned, from high-level strategy to the practical details of implementation.
The Strategic Value and Market Growth
The demand for this strategic guidance is growing. It's a direct response to a world that demands better operational efficiency and smarter, faster decisions. The global market for these services was valued at around USD 53.3 billion in 2024 and is set to grow significantly. This momentum shows how vital it is for UK organisations to weave advanced tech like cloud computing and data analytics into their very fabric. You can explore more details on the digital transformation market growth for a deeper dive.
A great consulting partner acts as a copilot, not a backseat driver. They bring an outside perspective to spot hidden inefficiencies and help you build a clear, no-nonsense roadmap. The outcome isn't a glossy slide deck. It’s a tangible plan with scoped pricing and defined deliverables that lead to real, measurable improvements.
Ultimately, this service is about building digital sovereignty. It gives your organisation the ability to own and manage its digital future with confidence. This keeps the capability inside your business, where it belongs, creating a sustainable impact long after the project is finished.
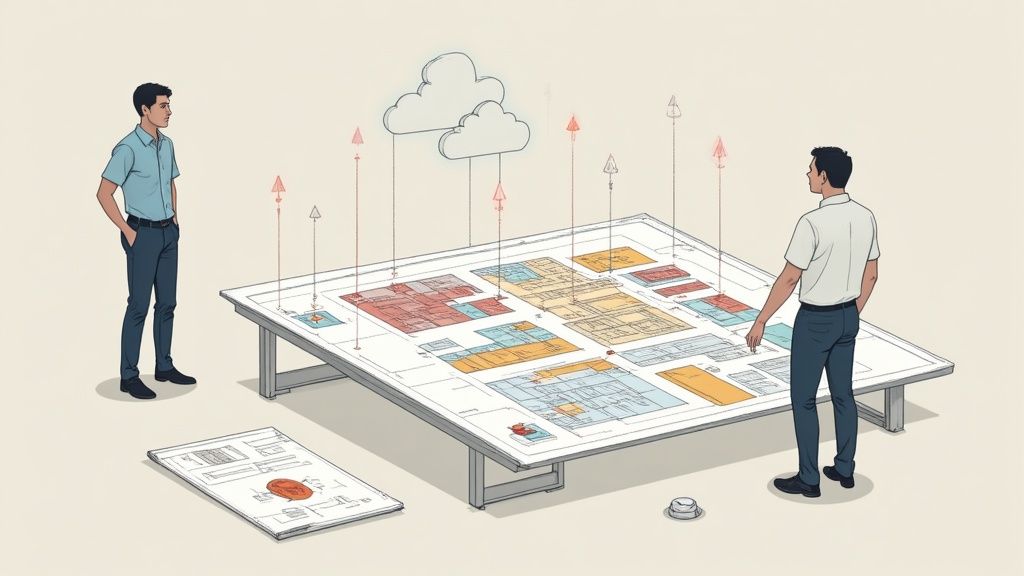
Ever feel like you’re trying to navigate through an operational fog? As a leader, you have a clear vision for how your organisation should run. But the day-to-day reality of how work actually gets done—how it moves between people and departments—can feel distant, murky, and out of focus.
It’s in this gap between perception and reality where inefficiency breeds, frustration builds, and real progress grinds to a halt.
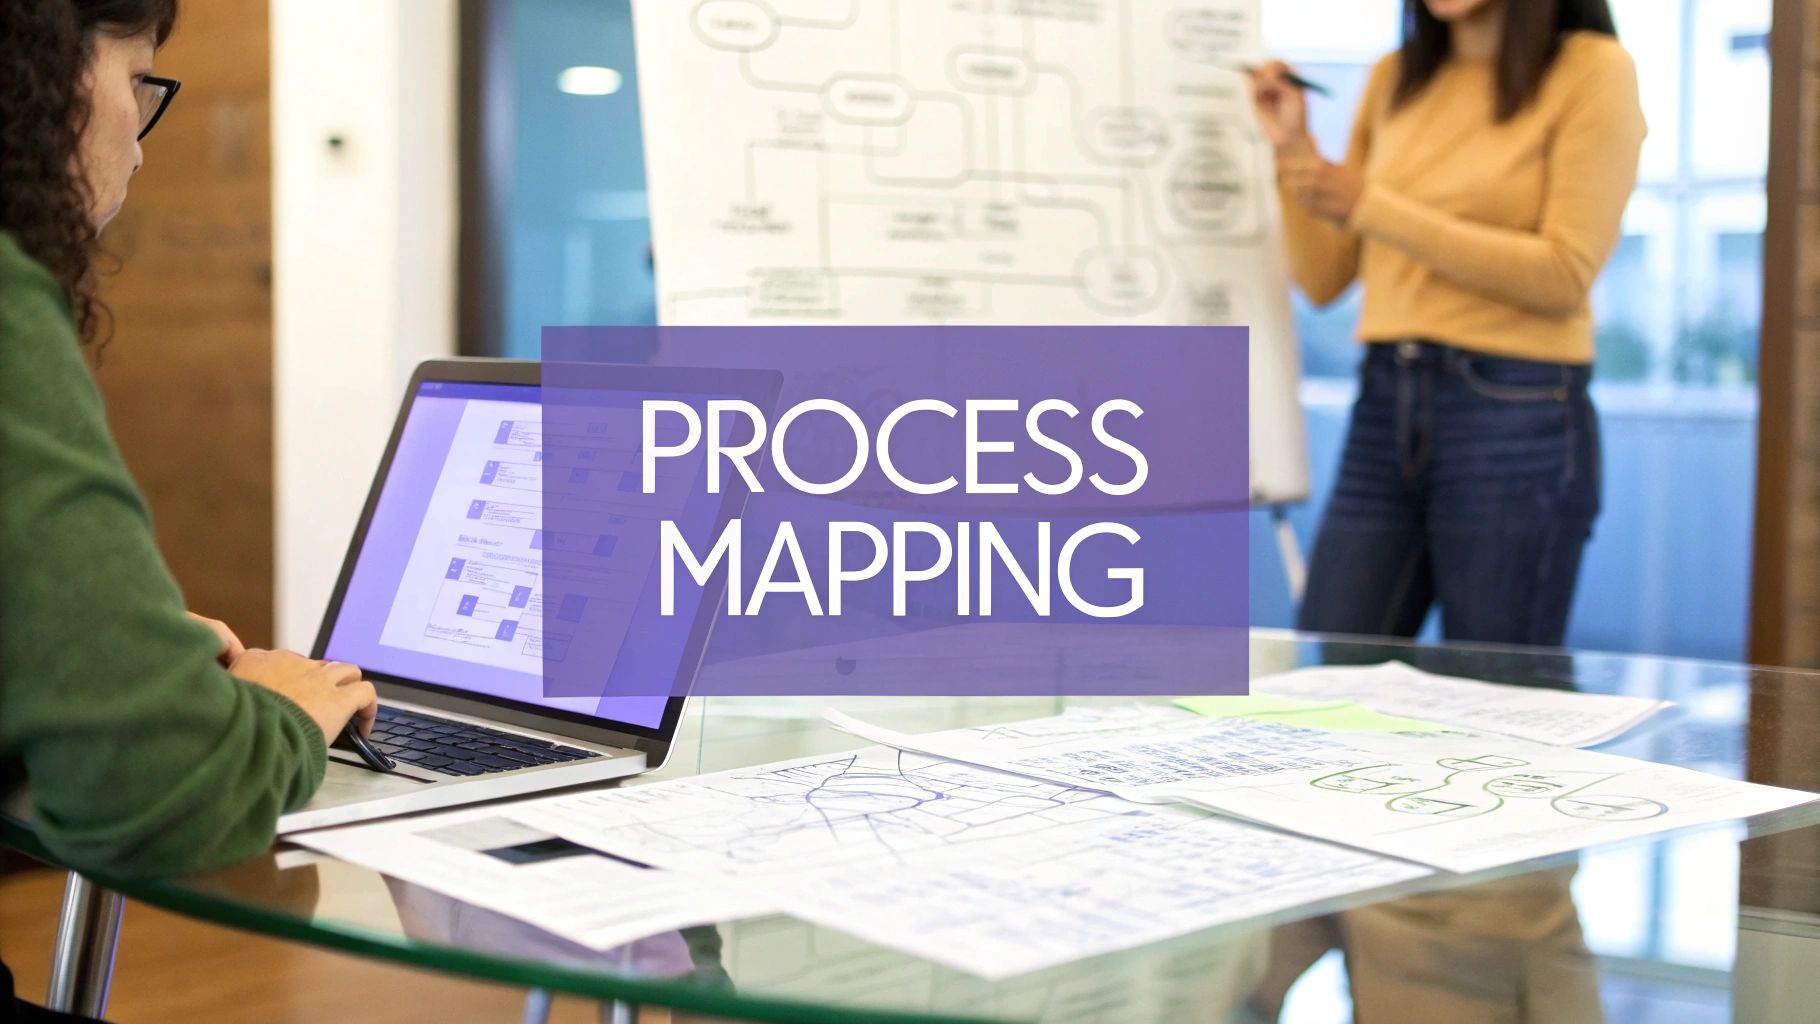
Seeing Your Business Clearly For The First Time
This is the exact problem business process mapping was designed to solve. It’s not about drawing up complex technical diagrams or writing dense procedure manuals that just gather dust. At its heart, it’s about creating a shared understanding.
Process mapping is the first crucial step to answering the most fundamental question of all: 'How does our business really work?'
From abstract ideas to a tangible picture.
Let’s be honest, most of your business processes don’t live in a neat, single document. They’re scattered across the minds of your team members, buried in email chains, and exist as unwritten rules that have simply evolved over time. This makes them almost impossible to see, let alone fix.
A process map takes all those abstract, invisible workflows and turns them into a tangible, shared picture. It’s the difference between hearing someone describe a journey and actually seeing the map. Suddenly, the route, the pit stops, and the potential roadblocks become crystal clear to everyone involved.
This simple act of making the invisible visible is incredibly powerful. For the first time, leaders can see the same reality their teams face every day. Teams can finally understand how their individual tasks connect to the bigger picture. This shared clarity is the only real foundation for meaningful change.
Why this is a people-first activity.
It’s easy to think of processes as cold, mechanical things, completely separate from the people who perform them. That's a common and costly mistake. We know that true transformation starts with people, not platforms. A process, after all, is just a human story of collaboration, handoffs, and decisions.
That's why effective process mapping has to be a collaborative exercise. It means:
Bringing the right people to the table. This must include the employees who do the work day-in, day-out. They hold the ground-truth knowledge.
Asking the right questions. We need to dig into the 'why' behind each step, not just the 'what'.
Actively listening to their challenges. Where do they get stuck? What eats up too much time? Where are the real points of friction?
When you put your people first, the map you create isn't just a diagram. It’s infused with the real-world context and human experience needed to spot genuine opportunities for improvement. You start to uncover the hidden bottlenecks and soul-crushing redundant tasks that drain morale and waste precious time.
Building the foundation for lasting change.
Without a clear map of your current reality (what we call the 'as-is' process), any attempt to improve is nothing more than a shot in the dark. You could spend a fortune on new tech or reshuffle an entire team, only to find you’ve solved the wrong problem or, even worse, created brand new ones.
An accurate process map provides the bedrock for smart, strategic action. It allows you to:
Standardise operations to ensure everyone follows the most effective and compliant path.
Pinpoint automation opportunities by highlighting the repetitive, manual tasks ripe for a digital solution.
Clarify roles and responsibilities, eliminating the confusion over "who does what" that causes so many delays.
Enable data-driven decisions by showing you exactly where to measure performance and track the impact of any changes you make.
Ultimately, business process mapping is the first, non-negotiable step toward building a more open, capable, and operationally sustainable organisation. It cuts through the fog, aligns your people, and creates the clarity you need to genuinely make business better. It's how you ensure the capability for improvement is built and owned inside your organisation, creating an impact that actually lasts.
The Real-World Value Of Mapping Your Processes
Let’s move past the textbook definitions and get to what really matters: results. Business process mapping is far from being a corporate box-ticking exercise. It's a vital tool for any organisation that's serious about modernising, scaling up, and winning back wasted time.
The true value isn't in the diagrams themselves, but in the brilliant clarity they create. It’s this clarity that lets leaders and their teams make sharper, evidence-based decisions that drive genuine improvements on the ground.
From frustration to efficiency.
Think about the small, daily frustrations that pile up across your teams. An invoice gets stuck waiting for an approval nobody can identify. A customer query bounces between departments because no one is quite sure who owns it. These aren't just minor irritations. They're symptoms of broken or poorly defined processes.
Mapping shines a light on these hidden problems. By actually visualising a task's journey from start to finish, you immediately spot the roadblocks.
Mini-example. A professional services firm mapped out its client onboarding process. They found that new clients were waiting an average of four days for their welcome pack. Why? A single person was manually entering the same data into three separate systems. This simple insight led to a small automation project that slashed the wait time to just two hours, transforming the client's first impression and freeing up that employee for higher-value work.
This is the core benefit of mapping. It replaces guesswork with facts, letting you fix the root cause of inefficiency instead of just patching over the symptoms. This is often the first step to unlocking the full benefits of business process automation.
More than just a diagram—it’s a strategic tool.
A clear process map does more than just fix today's problems. It lays the foundation for a more resilient and capable organisation. The insights you gain aren't fleeting. They become part of your company's collective intelligence, building capability that sticks.
Clarity creates efficiency. When everyone can see how work flows through the organisation, it becomes easier to align people, standardise workflows, and pinpoint exactly where new technology could have the most impact. This visual shared understanding is the starting point for genuine operational change.
This strategic approach is rapidly gaining ground. Process modelling and mapping are a cornerstone of the wider Business Process Management (BPM) field in the UK, making up around 35.56% of the market's revenue. With a projected annual growth of 20.7% from 2025, it's clear that leaders are waking up to its importance.
By mapping a process, you're essentially creating a blueprint for improvement. This blueprint is the critical first step before you can even think about bigger transformations. You can see how this all connects by reading our guide on what is process reengineering. It helps you answer the tough questions that unlock sustainable growth and give your teams back their most valuable resource: time.
Choosing The Right Process Mapping Method
There's more than one way to map a business process, and picking the right method is critical. This isn't about finding the most complicated-looking diagram. It's about selecting the simplest tool that actually solves your specific problem. A one-size-fits-all approach just leads to beautiful but useless charts that gather digital dust.
We believe in clarity over complexity. The right mapping method is the one that best helps your team see the workflow, pinpoint the friction, and agree on what needs to change. Let’s demystify some of the most practical techniques, skipping the academic jargon to focus on what works in the real world.
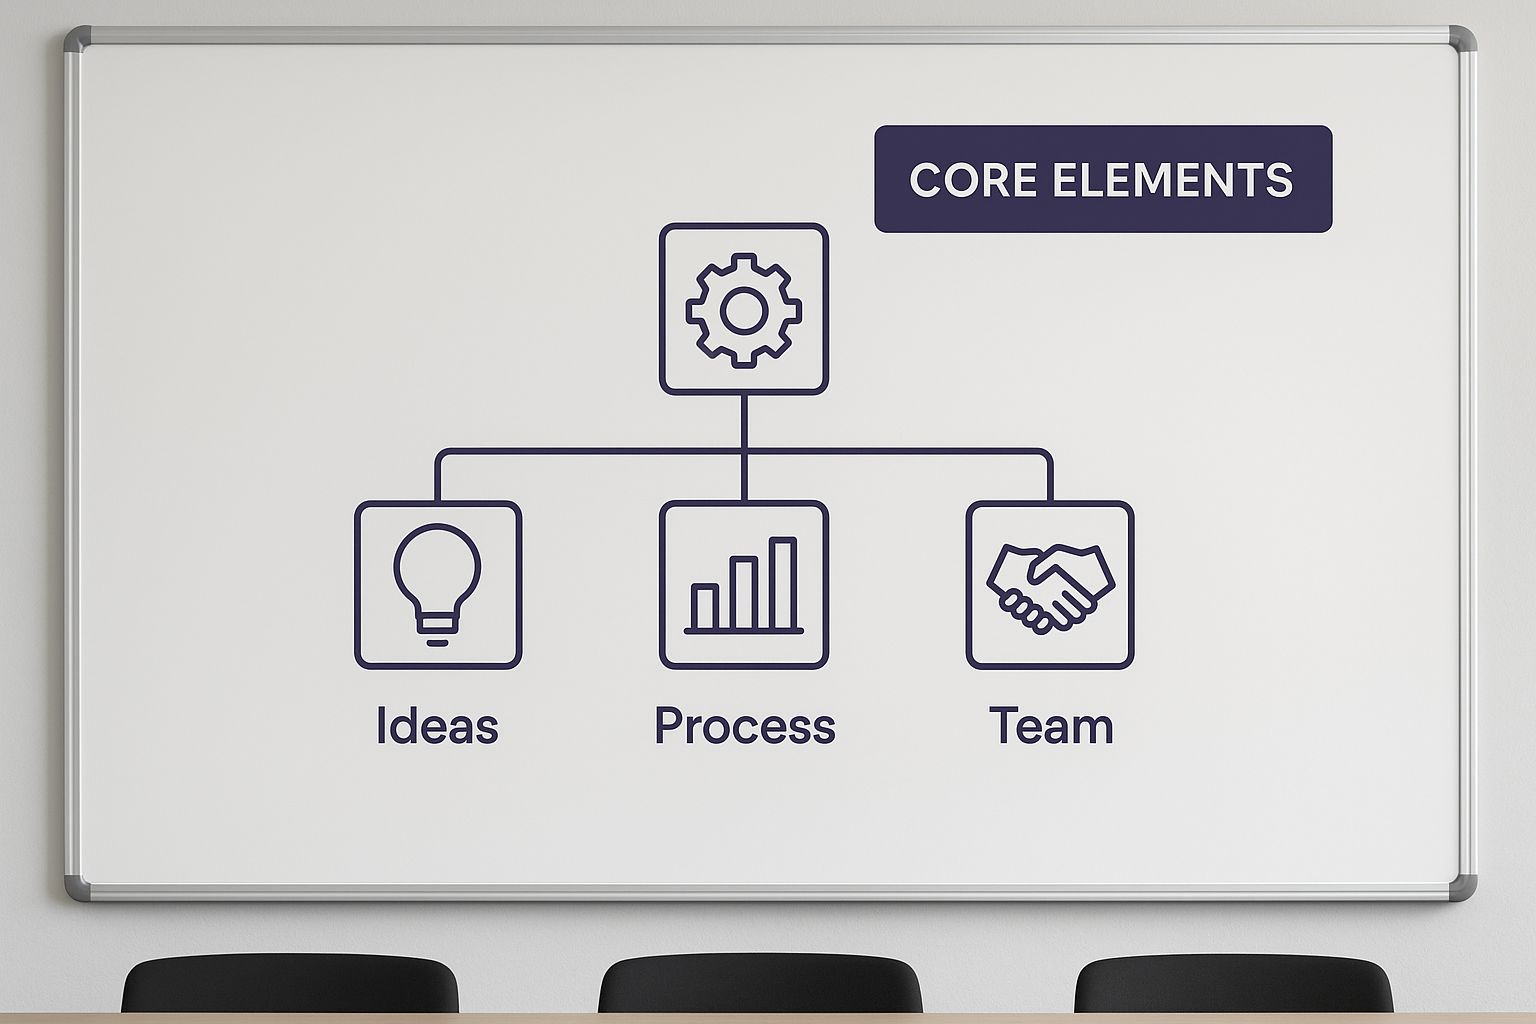
Before we dive in, take a look at this. It nails the core elements that every good process map should have, no matter which method you end up using.
As you can see, a great map always visualises the flow of activities, the key decisions, and the people involved. It’s all about creating a shared understanding of how things really work.
The basic flowchart.
This is the most common and straightforward way to get started. A basic flowchart uses simple, standard symbols to show the sequence of steps, decisions, and outcomes in a single, linear process.
Think of it as the foundational tool in your kit. It's perfect for documenting simple, self-contained workflows that are handled by just one person or a single team.
Best for: Mapping out straightforward tasks like submitting an expense claim or requesting annual leave.
Who needs to be in the room? The person or team members who actually own and carry out the process from start to finish.
The goal here is pure simplicity and clarity. If you're just dipping your toes into process mapping, a basic flowchart is the ideal way to build confidence and get some quick wins.
The swimlane diagram (cross-functional flowchart).
What happens when a process crosses departmental lines? This is where many businesses get bogged down. Hand-offs between teams are notorious friction points, often leading to delays, crossed wires, and a complete lack of accountability.
This is the exact problem a swimlane diagram is designed to fix. It organises all the process steps into horizontal or vertical "lanes," where each lane represents a different team, department, or even a specific person. You can instantly see who is responsible for what and, more importantly, where work grinds to a halt as it moves from one lane to another.
If you constantly hear phrases like, "I thought marketing was handling that," or, "I'm still waiting on finance to get back to me," a swimlane diagram is the tool you need. It makes accountability visual and undeniable.
Best for: Untangling complex, cross-functional processes like customer onboarding, procurement, or new product development.
Who needs to be in the room? You absolutely need representatives from every single department involved. If you don't have everyone's input, the map will be incomplete and worthless.
Value stream mapping (VSM).
While flowcharts show the steps in a process, Value Stream Mapping (VSM) goes a level deeper. It's a lean-management method focused on analysing the flow of information and materials required to deliver a product or service to a customer.
A VSM forces you to ask a crucial question for every single step: 'Does this activity add value from the customer's perspective?'
This method ruthlessly separates value-adding activities from non-value-adding waste. It’s not just about the tasks themselves, but also about the time spent waiting between them. This is often where the biggest, most frustrating inefficiencies are hiding.
Best for: Identifying and slashing waste in production or service delivery to boost efficiency and improve the customer experience.
Who needs to be in the room? A cross-functional team is essential. You’ll need people from operations, logistics, sales, and customer service, plus a leader who can sponsor the changes you uncover.
To help you decide, here's a quick comparison of these common methods. The goal is to match the tool to the business challenge you're facing.
Choosing the right process mapping method.
Mapping Method
Best For Visualizing
Key Benefit
Basic Flowchart
A single, linear sequence of steps and decisions.
Simplicity and clarity. Perfect for getting started.
Swimlane Diagram
How work moves between different teams or departments.
Exposes cross-functional friction and clarifies accountability.
Value Stream Map (VSM)
The flow of value and waste from a customer's viewpoint.
Pinpoints inefficiencies and wait times to improve speed and quality.
By picking the right technique from the start, you set yourself up for success. You’ll create a map that delivers practical insights and real change, not just another document destined for a forgotten folder.
How To Map A Business Process Step-By-Step
Right, so you understand what process mapping is and why it’s worth doing. But let's be honest, theory is one thing. Actually kicking off your first project is where the real work—and the real value—begins. It can feel like a massive task, but the trick is to break it down into smaller, more manageable steps.
This isn’t about drawing perfect diagrams for the sake of it. Think of it as a collaborative investigation, a team effort to build a shared picture of how things actually work. The goal is a genuine 'as-is' map that everyone understands and agrees on. That’s your foundation for any meaningful change.
1. Pin down the process and its boundaries.
First things first: you have to be laser-focused on what you're mapping. Vague goals are the enemy here. They lead to sprawling, useless diagrams that gather digital dust. Ask your team: which specific process is causing the most headaches or eating up the most time?
Once you have a target, you need to define its start and end points.
Start point. What’s the precise trigger that kicks this whole thing off?
End point. What’s the final outcome that tells you the process is well and truly finished?
For example, let's take 'client onboarding'. The trigger might be a 'signed contract received', and the end point could be 'client has full system access and has completed their kick-off call'. Setting these boundaries stops the map from bleeding into every other part of the business and becoming an unmanageable mess.
2. Get the right people in the room.
A process map created by one person in a quiet office is a work of fiction. Simple as that. The most critical factor for success is getting the right people involved. This means you absolutely must include the people who do the work day in, day out. They hold the ground truth.
Don't just invite managers. A proper mapping team is a mix of people from every department the process touches. If a task gets handed from sales to finance and then to operations, you need someone from each of those teams in the workshop. As we often say, it takes a whole team to digitally transform a business.
3. Dig for information in a workshop.
Now it's time to bring your hand-picked team together. The best way to get the real story is through an interactive workshop, not by sending out a dry questionnaire that everyone will ignore. Grab a whiteboard, a stack of sticky notes, or fire up a digital tool like Miro.
The aim is to pull every step, decision, and handover out of people's heads and onto a shared canvas. You'll need to ask good questions to get the ball rolling:
"So, what happens next?"
"Who is responsible for that?"
"Roughly how long does that bit take?"
"What information do you need before you can start your part?"
"What always seems to go wrong at this stage?"
This is how you uncover all the informal workarounds and hidden frustrations that official procedure manuals never mention.
Remember, the map itself is just the output. The real magic happens in the conversation. It’s those 'aha!' moments and the shared understanding you build together that truly matter.
4. Sketch out your first 'as-is' map.
As the workshop progresses, you can start sketching out the initial 'as-is' map. This is your first draft, a visual snapshot of the current reality. Don't get hung up on making it pretty. Just focus on capturing the flow accurately, warts and all. Include all the messy exceptions and bottlenecks you've uncovered.
Once you’ve got the 'why' sorted, the natural next step is learning exactly how to create a process map, turning those workshop ideas into a clear visual. This first draft becomes your baseline, the starting point for all future analysis and improvements.
The need to get this right is stark, particularly in the UK. Despite all our technology, a shocking 82% of UK organisations still lean on manual methods or rickety spreadsheets for their core processes. Some businesses are reportedly trying to manage their work with as many as 10,000 different Excel files, creating a massive amount of hidden risk.
5. Review, refine, and repeat.
Finally, take your drafted map back to the team for a reality check. Share it around and ask one simple question: "Does this look right to you? Is this how things really work?" This is your chance to catch any mistakes, fill in the blanks, and get everyone's final nod.
This review cycle is non-negotiable. It ensures the final map isn't just one person's opinion but a true, collectively-owned picture of the process. Once you have that validated 'as-is' map in your hands, you can finally stop guessing and start making smart, targeted improvements.
Turning Your Process Map Into Meaningful Change
So, you’ve created a clear, collaborative process map. That’s a huge step forward. For the first time, you and your team have a shared picture of how work actually gets done. But the map itself isn't the final destination. Its real value is only unleashed in what you do next.
A great map isn't a trophy to hang on the wall and admire. It's a tool to be used. Think of it as a catalyst for genuine, lasting change. This is where the real work begins. Spotting hidden inefficiencies, identifying true bottlenecks, and uncovering powerful opportunities for improvement. It's the essential starting point for designing a better 'to-be' process, one that frees up your team's time and drives real impact.
From 'as-is' analysis to 'to-be' design.
With your validated 'as-is' map in hand, you can finally shift from simply documenting to analysing. Get the same cross-functional team that helped build the map back in a room and start asking some tough questions. The goal here isn't to assign blame, but to have an honest, collective look at the workflow.
Look for the usual suspects that drain time and energy:
Redundant tasks. Are people entering the same data into multiple systems?
Unnecessary handoffs. Does a simple task bounce between far too many people or departments?
Long wait times. Where does work just sit idle, waiting for an approval or the next action?
Process bottlenecks. Is there one person or a single step that consistently grinds everything to a halt?
By asking these questions, you start to connect the dots between the visual map and the day-to-day friction your people experience. This is the moment you move beyond just seeing the problem to actively designing the solution.
Your 'as-is' map tells you where you are. The analysis of that map tells you where you need to go. It’s the bridge between acknowledging a problem and building a smarter, more efficient future state.
Connecting mapping to digital transformation.
This analytical step is where process mapping truly becomes the engine for digital transformation. Your map provides the hard evidence you need to make smart technology decisions. Instead of buying new software based on a flashy sales pitch, you can target investment where it will have the biggest impact, grounded in your operational reality. To see how this plays out in the real world, exploring concrete business process automation examples can show how properly mapped processes lead to massive efficiency gains.
This is fast becoming a key focus for UK businesses. By 2025, it's expected that nearly 39% of UK firms will prioritise AI-dependent automation in their improvement plans, with around 50% making major investments in advanced technologies like Robotic Process Automation (RPA). These tools are powerful, but they are only effective when you apply them to a process you already understand inside and out.
Embedding capability that lasts.
Ultimately, the goal of this entire exercise is to build capability that stays inside your organisation. The insights you gain and the improvements you make should empower your team, not create a long-term dependency on outside consultants. This is where a people-first approach is non-negotiable. By involving your team in the analysis and redesign, you’re not just changing a process. You're changing how they think about their work. They become owners of the solution.
Of course, implementing these new ways of working will likely face some pushback. It’s human nature to resist shifts in routine. Understanding how to navigate this is crucial for making sure the new 'to-be' process is actually adopted and sticks. We share practical advice for this in our guide on overcoming resistance to change in digital transformation.
Turning your map into meaningful change is all about creating a cycle of continuous improvement. You map, you analyse, you improve, and you empower your people to do it all again. This is how you build a more open, capable, and operationally sustainable organisation—one that is ready for whatever comes next.
Common Questions About Business Process Mapping
Even with a solid grasp of what business process mapping is, it's completely normal to have a few practical questions before you dive in. We get it. You want to know what the real investment of time and resources will look like before committing.
We've pulled together the most common questions we hear from leaders and change-makers. The answers are straight-talking and grounded in our experience helping organisations just like yours cut through the operational fog.
How long does business process mapping take?
This is usually the first question out of the gate, and the honest answer is: it really depends on the complexity of the process you're looking at. There's no one-size-fits-all timeline.
A single, straightforward workflow—think of a simple content approval process within one team—can often be mapped out in a collaborative workshop over just a few hours. These are fantastic quick wins that build momentum.
On the other hand, a complex, cross-departmental beast like an end-to-end customer onboarding journey could take several weeks to map properly. This involves wrangling schedules with multiple teams, pulling data from different systems, and getting a much larger group of stakeholders to validate the final map.
The goal isn't speed. It's accuracy and shared understanding. Rushing things only gets you a flawed map, which is worse than having no map at all. Investing the right amount of time upfront saves countless hours and headaches down the line.
What tools do we need for business process mapping?
It's easy to get bogged down by the tech, but the truth is, you can start incredibly simply. In fact, we often recommend it.
You can kick things off with nothing more than a whiteboard, a pack of sticky notes, and a good marker pen. The most crucial ‘tool’ is the conversation you have with the people who actually do the work every day. Their insights are what bring the process to life.
Once you're ready for something more formal and shareable, digital tools are fantastic. Platforms like Miro, Lucidchart, or Microsoft Visio are excellent for creating clean, professional diagrams that are easy to store and update. They also make collaborating with remote or distributed teams a breeze.
But we'll always stand by our core belief: true transformation starts with people, not platforms. The software should be there to support the discussion, not dictate it. Don't let picking a tool become a reason not to start.
Is business process mapping only for large companies?
Absolutely not. This is one of the biggest myths we come across. Process mapping offers huge value to organisations of any size, from a growing 50-person firm to a multinational corporation.
For small-to-mid-sized businesses (SMEs). Mapping is a powerful way to build scalable foundations for growth. As you hire more people, documented processes ensure everyone is on the same page, preventing the chaos that can easily choke expansion. It helps you professionalise your operations before you hit a wall.
For larger organisations. Mapping is essential for sniffing out the massive inefficiencies that hide in departmental silos. It’s often the only way to untangle complex legacy workflows and get everyone aligned across a large and diverse workforce.
The bottom line is simple. If you have people, you have processes. If you want to improve how those people work together, business process mapping gives you the clarity to make it happen, no matter how big or small your company is.
What is the difference between process mapping and process modelling?
This is a great question. The terms are often thrown around interchangeably, but they represent two very distinct stages of improvement. Getting the difference clear helps you understand the journey from insight to action.
Think of it like this:
Process mapping is like creating the foundational blueprint of a building. It visually lays out all the steps, handoffs, and decisions in a process exactly as it exists today (the 'as-is' state). Its main job is to create a shared, factual picture of your current reality.
Process modelling, on the other hand, is what an architect does with that blueprint. It’s the next level of analysis. Modelling uses the map as a starting point to simulate, analyse, and design better 'to-be' processes. You might add data layers—like costs, timings, and resource use—to predict the impact of changes before you actually make them.
In short, mapping shows you where you are. Modelling helps you test different paths to decide where you should go next. One builds clarity, the other tests hypotheses. Both are critical for making smart, sustainable changes to your operations.